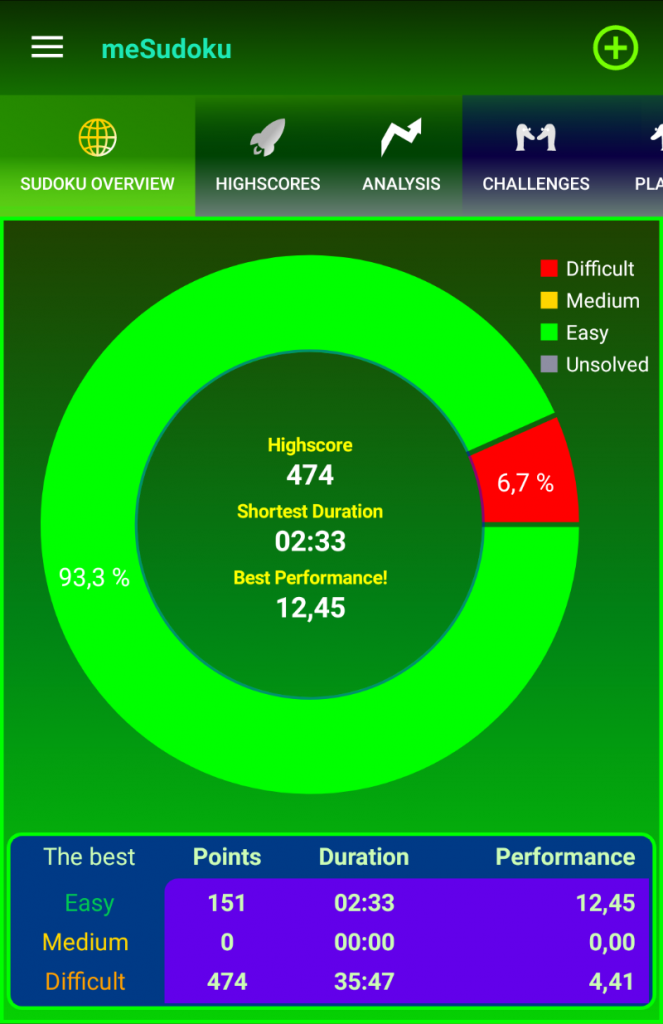
Sudoku overview screen
Shows the absolute best values. The pie chart segments represent the count of games played in each level. In the hole of the pie chart the best values are shown independent from level. The table below the pie chart shows the best values reached for each level. The origin of the values can be from multiple games.

Highscore screen
Shows for each level the results of all played games ordered by points and duration. Absolute best values are decorated with icons.
Use the level switches to view the results of the other levels.
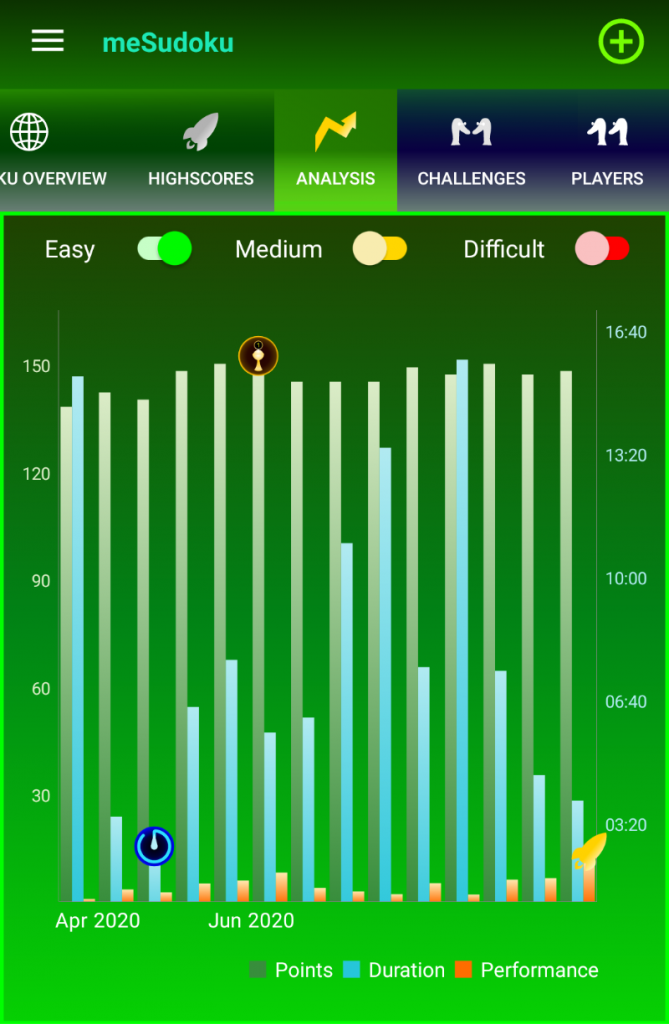
Analysis screen
Shows for each level the results of all played games ordered by game date. Absolute best values are decorated with icons.
Use the level switches to view the results of the other levels.
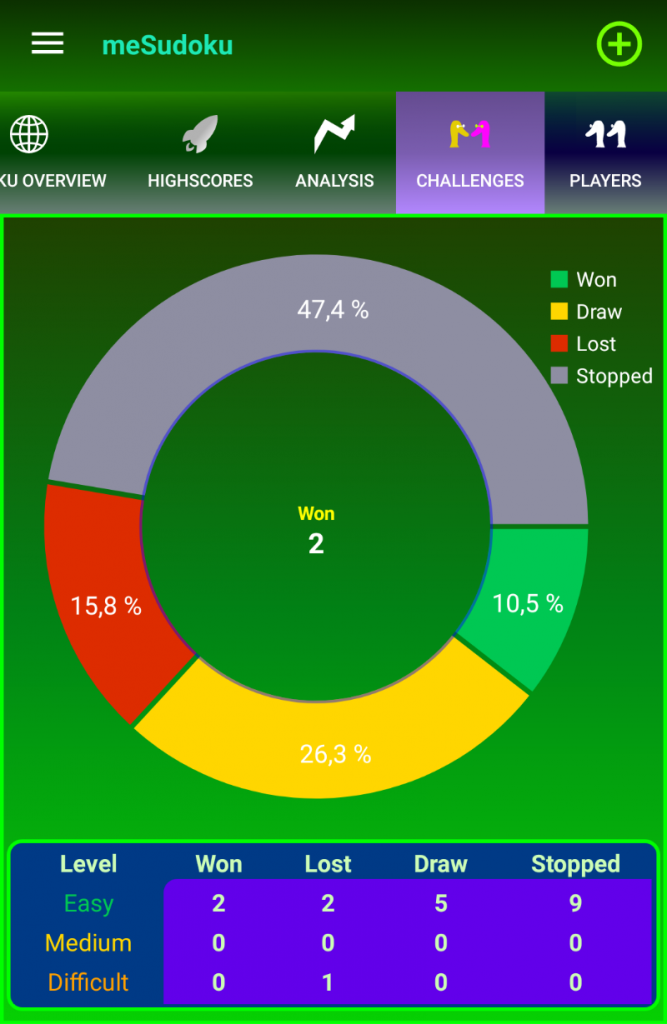
Challenges overview screen
The pie chart segments represent the over all result balance of challenges played. In the hole of the pie chart the count of won challenges is shown. The table below the pie chart shows the result balance dependent of level.
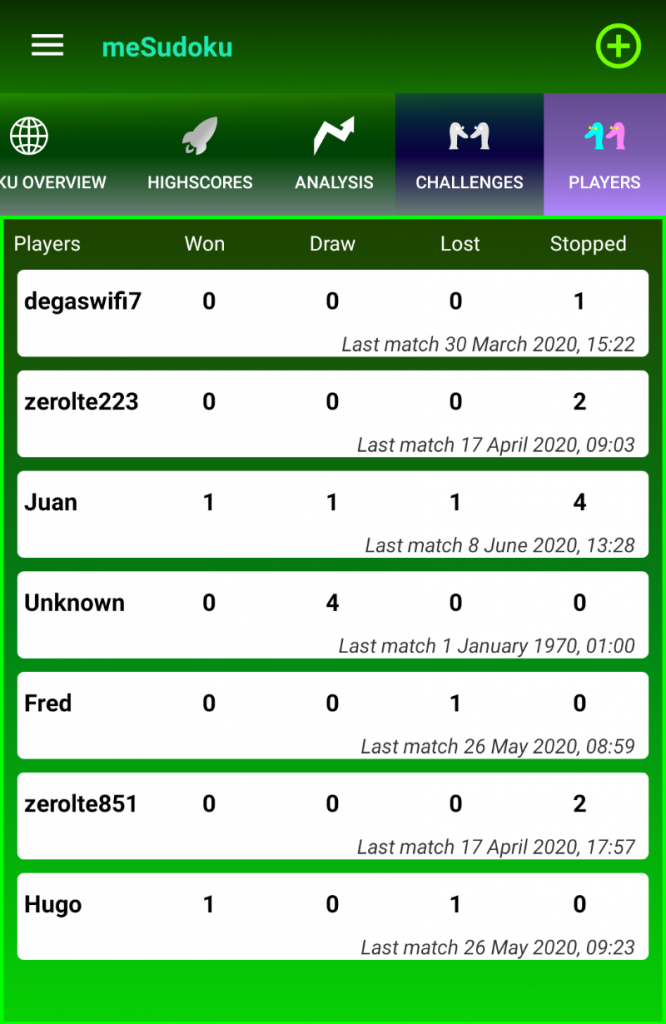
Player balance screen
This screen shows your result balance of challenges grouped by the players you played with.